Understanding Measures of Central Tendency
In the realm of statistics, understanding the characteristics of a dataset is paramount. One of the most fundamental ways to summarize a dataset is by identifying its center. Statistics primarily employs three key measures to pinpoint this central point: the Mean, the Median, and the Mode. Each offers a unique perspective on the typical value within a collection of data.
These measures of central tendency provide a single value that attempts to describe the entire dataset. Whether you're analyzing survey results, financial data, or scientific observations, grasping the Mean, Median, and Mode is essential for drawing meaningful conclusions.
The Mean: Calculating the Arithmetic Average
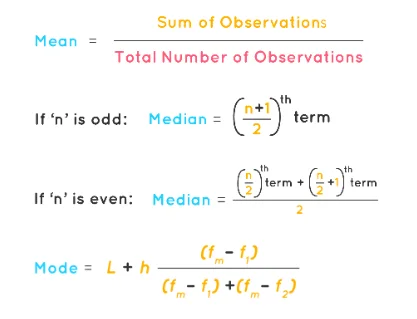
The Mean, often referred to as the arithmetic average, is calculated by summing all the values in a dataset and then dividing by the total number of observations. It is symbolized as x̄ (x-bar).
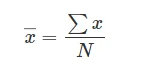
The formula for the mean of a simple dataset is:
x̄ = Σx / n
Where:
- Σx represents the sum of all observations.
- n represents the total number of observations.
For datasets presented in tabular or frequency form, the mean calculation is slightly adjusted:
Mean = Σfx / Σf
Here, Σf = N (the total number of observations), and Σfx is the sum of the products of each observation (x) and its corresponding frequency (f).
Example 1: Simple Dataset
Consider the dataset: 2, 4, 7, 11, 17.
Sum of observations (Σx) = 2 + 4 + 7 + 11 + 17 = 41
Total number of observations (n) = 5
Mean (x̄) = 41 / 5 = 8.2
Example 2: Tabular/Frequency Data
Using the following data:
| x | 4 | 12 | 11 | 5 | 3 |
|---|---|---|---|---|---|
| f | 2 | 4 | 7 | 11 | 17 |
| xᵢ | fᵢ | xᵢfᵢ |
|---|---|---|
| 2 | 4 | 8 |
| 4 | 12 | 48 |
| 7 | 11 | 77 |
| 11 | 5 | 55 |
| 17 | 3 | 51 |
| ∑ fᵢ = 35 | ∑ xᵢ fᵢ = 239 |
Mean = Σfx / Σf = 239 / 35 ≈ 6.83
The Median: Finding the Middle Ground
The Median represents the middle value in a dataset when all observations are arranged in ascending or descending order. It is unaffected by extreme values, making it a robust measure of central tendency, especially for skewed datasets.
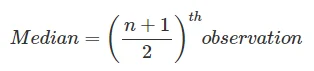
The method for finding the median depends on whether the total number of observations (n) is odd or even.
If n is odd:
Median = (n + 1) / 2 th observation
If n is even:
The median is the average of the two middle values.

Median = Average of the (n / 2)th and ((n / 2) + 1)th observations
Example 1: Odd number of observations
Dataset: 3, 5, 8, 10, 12.
The data is already sorted. n = 5 (odd).
Median position = (5 + 1) / 2 = 3rd observation.
The 3rd observation is 8. So, the median is 8.
Example 2: Even number of observations
Dataset: 3, 5, 8, 10, 12, 15.
The data is already sorted. n = 6 (even).
The middle positions are n/2 = 6/2 = 3rd and (n/2)+1 = (6/2)+1 = 4th observations.
The 3rd observation is 8 and the 4th observation is 10.
Median = (8 + 10) / 2 = 18 / 2 = 9.
The Mode: Identifying the Most Frequent Value
The Mode is the value that appears most frequently in a dataset. It's also often remembered as the "Most Often Data Entered." A dataset can have one mode (unimodal), two modes (bimodal), three modes (trimodal), or multiple modes (multimodal). If all values appear with the same frequency, there is no mode.
Example 1: Unimodal Dataset
Dataset: 2, 4, 4, 7, 11, 17.
The number 4 appears twice, which is more than any other number. Therefore, the mode is 4.
Example 2: Multimodal Dataset
Dataset: 2, 4, 4, 7, 7, 11, 17.
Both 4 and 7 appear twice. This dataset is bimodal, with modes of 4 and 7.
Example 3: No Mode
Dataset: 2, 4, 7, 11, 17.
Each number appears only once. There is no mode for this dataset.
Illustrative Examples with Frequency Distributions
Let's explore how to find the Mean, Median, and Mode for grouped data.
Calculating Mean from Frequency Data
When data is presented in classes with frequencies, we often use the class mark (midpoint of the class) for calculations.
Example: Library Visits
| Number of Students | Number of days visiting Library |
|---|---|
| 0-10 | 3 |
| 10-20 | 5 |
| 20-30 | 8 |
| 30-40 | 10 |
| 40-50 | 6 |
| 50-60 | 7 |
To calculate the mean, we first find the class mark (xᵢ) for each class and then calculate xᵢfᵢ.
| Classmark (xᵢ) | Frequency (fᵢ) | xᵢfᵢ |
|---|---|---|
| 5 | 3 | 15 |
| 15 | 5 | 75 |
| 25 | 8 | 200 |
| 35 | 10 | 350 |
| 45 | 6 | 270 |
| 55 | 7 | 385 |
| Total | ∑ fᵢ = 39 | ∑ fᵢxᵢ = 1295 |
Mean = Σfᵢxᵢ / Σfᵢ = 1295 / 39 ≈ 33.21 days
Finding the Median from Frequency Data
For grouped data, we first need to determine the position of the median and then find the class where this position falls. Cumulative frequency is essential here.
Example: Class attendance
| Classes | Number of students | Cumulative frequency |
|---|---|---|
| 0-10 | 10 | 10 |
| 10-20 | 2 | 2 + 10 = 12 |
| 20-30 | 12 | 12 + 12 = 24 |
| 30-40 | 18 | 18 + 24 = 42 |
| 40-50 | 3 | 3 + 42 = 45 |
Total number of observations (N) = 45 (odd).
Median position = (N + 1) / 2 = (45 + 1) / 2 = 23rd observation.
Looking at the cumulative frequency, the 23rd observation falls into the 30-40 class (since the cumulative frequency up to 20-30 is 24).
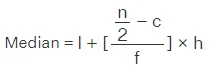
The median class is 30-40. We can use the median formula for grouped data: Median = L + [((N/2) - CF) / f] * w, where L is the lower boundary of the median class, N is the total frequency, CF is the cumulative frequency of the class preceding the median class, f is the frequency of the median class, and w is the class width.
L = 30, N = 45, CF = 24 (cumulative frequency of 20-30 class), f = 18, w = 10.
Median = 30 + [((45/2) - 24) / 18] * 10 = 30 + [(22.5 - 24) / 18] * 10 = 30 + [-1.5 / 18] * 10 = 30 - 0.83 = 29.17
Determining the Mode from Frequency Data
The mode for grouped data, known as the modal class, is the class with the highest frequency.
Example: Student Categories
| Category | 0-10 | 10-20 | 20-30 | 30-40 | 40-50 |
|---|---|---|---|---|---|
| Frequency | 7 | 22 | 9 | 28 | 13 |
The highest frequency is 28, which corresponds to the 30-40 category. Therefore, the modal class is 30-40.
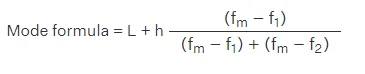
For a more precise mode in grouped data, the formula is: Mode = L + [ (f₁ - f₀) / (2f₁ - f₀ - f₂) ] * w, where L is the lower boundary of the modal class, f₁ is the frequency of the modal class, f₀ is the frequency of the preceding class, f₂ is the frequency of the succeeding class, and w is the class width.
L = 30, f₁ = 28, f₀ = 9, f₂ = 13, w = 10.
Mode = 30 + [ (28 - 9) / (2*28 - 9 - 13) ] * 10 = 30 + [ 19 / (56 - 22) ] * 10 = 30 + [ 19 / 34 ] * 10 = 30 + 5.59 = 35.59
Understanding Data Spread: The Range
While measures of central tendency describe the center of a dataset, the Range provides a simple measure of its spread. It is calculated as the difference between the highest and lowest values in the dataset.
Example: For the dataset 2, 4, 7, 11, 17, the highest value is 17 and the lowest is 2. The range is 17 - 2 = 15.
Frequently Asked Questions (FAQs)
Important Links & Resources
Recommended Reads
- AIIMS NORCET 11 Prelims Exam City 2026: Release Date, Steps & Details
- AP TET Response Sheet & Initial Answer Key 2026 Released: Check Scores & Raise Objections
- Bank of Baroda LBO Previous Year Papers: Benefits & Strategy
- BPSC TRE 4.0 2026: Major Changes, Exam Pattern, and Vacancy Details
- CPCB Recruitment 2026: Apply for 51 Contractual Posts Under SER Phase III
- Bank of Baroda LBO Salary 2026: Structure, Allowances & Growth
College Attendance & Bunk Planner
Calculate how many classes you must attend or can safely skip to maintain the mandatory 75% attendance criteria.
Never miss another exam update!
Get the fastest exam results, recruitment news, and educational guides delivered directly to your phone.